Ester Hydrolysis MechanismsAlkaloids OverviewAlkaloid Structure MethodsStructure Elucidation of NicotineIntroduction to DrugsClassification of Drugs: PharmacodynamicsWhy Do We Take Paracetamol in Fever?Types of SolventsSustainable SolventsNucleophile and ElectrophileReactions of MaltoseFunctional GroupsSN1 and SN2 ReactionsGrignard ReagentE1 and E2 Elimination
Corrosion OverviewVSEPR TheoryBond Angle Deviations in VSEPRVSEPR Theory and Molecular PolarityLewis Structures, Formal Charge & ResonanceLewis Dot StructureSuperacids and Liquid AmmoniaTypes of ReactionsAdvanced Types of ReactionsPeriodic Trends (Periodicity)Hydrogen BondingRoasting and CalcinationRelativistic Effects in Heavy Metals
Ajanta Cave PaintingsChemical Principles of Food PreservationAncient Indian Methods of Food PreservationChemicals Used in Food PreservationHow were clothes dyed?Ancient Indian Glass and Ceramic TechnologyAncient Indian MetallurgyAncient Chemistry of Cosmetics & Perfumery
Conductometric Titration: Strong Acid vs. Strong BaseArrhenius EquationQuantum YieldStates of MatterWeston Standard CellElectrochemistry
Chemistry Studio
Functional Group ExplorerChemical Structure Editor

JAtone.

Notes & guides

Learn
Ester Hydrolysis MechanismsAlkaloids OverviewAlkaloid Structure MethodsStructure Elucidation of NicotineIntroduction to DrugsClassification of Drugs: PharmacodynamicsWhy Do We Take Paracetamol in Fever?Types of SolventsSustainable SolventsNucleophile and ElectrophileReactions of MaltoseFunctional GroupsSN1 and SN2 ReactionsGrignard ReagentE1 and E2 Elimination
Corrosion OverviewVSEPR TheoryBond Angle Deviations in VSEPRVSEPR Theory and Molecular PolarityLewis Structures, Formal Charge & ResonanceLewis Dot StructureSuperacids and Liquid AmmoniaTypes of ReactionsAdvanced Types of ReactionsPeriodic Trends (Periodicity)Hydrogen BondingRoasting and CalcinationRelativistic Effects in Heavy Metals
Ajanta Cave PaintingsChemical Principles of Food PreservationAncient Indian Methods of Food PreservationChemicals Used in Food PreservationHow were clothes dyed?Ancient Indian Glass and Ceramic TechnologyAncient Indian MetallurgyAncient Chemistry of Cosmetics & Perfumery
Conductometric Titration: Strong Acid vs. Strong BaseArrhenius EquationQuantum YieldStates of MatterWeston Standard CellElectrochemistry
Chemistry Studio
Functional Group ExplorerChemical Structure Editor

JAtone.

Notes & guides

Learn
J
JAtone
Homephysical chemistry
|

Conductometric Titration: Strong Acid vs. Strong Base — Curve & Notes PDF

  • Endpoint found by the V-shaped minimum in the conductance vs. volume graph
  • H⁺ has highest ionic mobility — initial conductance is very high
  • PQ falls: H⁺ replaced by slow-moving Na⁺ as neutralisation proceeds
  • Q (Equivalence Point): only NaCl + H₂O — minimum conductance
  • QR rises: excess OH⁻ added — second highest ionic mobility
Reaction InvolvedTitration CurveFour Stages of the TitrationA. Initial Stage — Point P (Before any NaOH is added)B. Before the Equivalence Point — Line PQ (Adding NaOH drop by drop)C. At the Equivalence Point — Point QD. After the Equivalence Point — Line QR (Excess NaOH)Summary TableWhy This Method Is Better Than IndicatorsKey Inferences

Conductometric titration is a method in which the endpoint of a titration is determined by measuring the change in electrical conductance of the solution as titrant is gradually added.

Reaction Involved

HCl + NaOH → NaCl + H₂O

Both acid and base are strong electrolytes — they dissociate completely in water:

HCl → H⁺ + Cl⁻
NaOH → Na⁺ + OH⁻

Titration Curve

The curve is a plot of conductance (mS) on the Y-axis versus volume of NaOH added (mL) on the X-axis.
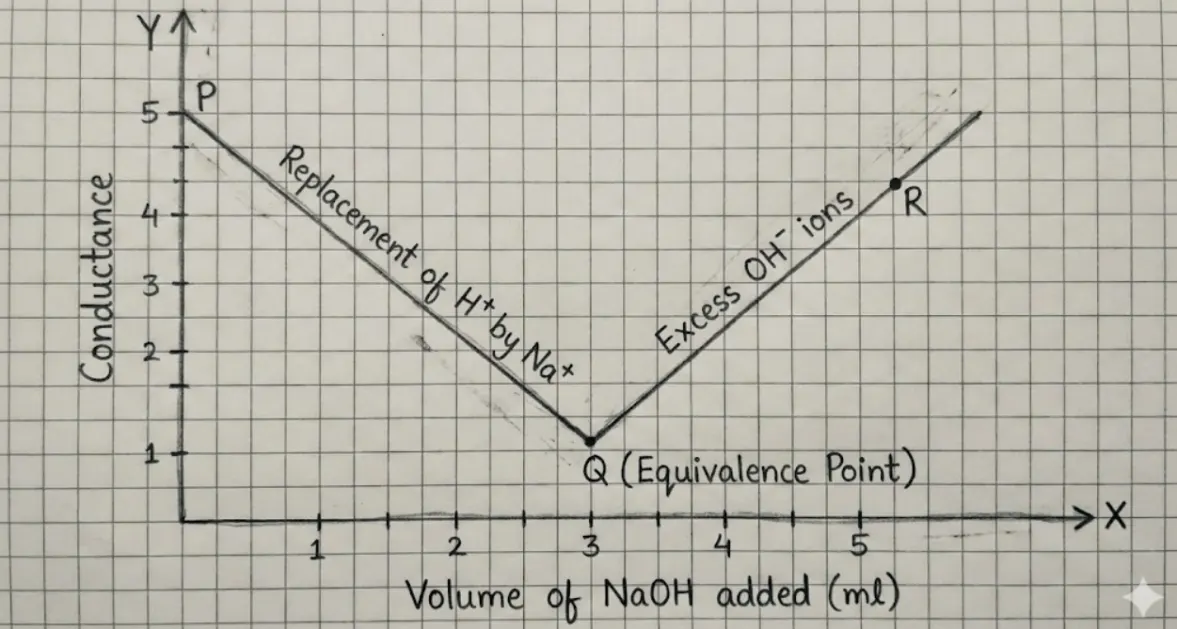
Conductometric Titration Curve — HCl vs. NaOH showing V-shaped minimum at equivalence point

Four Stages of the Titration

A. Initial Stage — Point P (Before any NaOH is added)

  • The solution contains only HCl, fully dissociated into H⁺ and Cl⁻ ions.
  • H⁺ ions have the highest ionic mobility of all known ions (due to the Grotthuss/proton-hopping mechanism).
  • Therefore, conductance is very high at the start.
  • High H⁺ concentration → Very high conductance → Point P is the highest point on the descending line PQ.

    B. Before the Equivalence Point — Line PQ (Adding NaOH drop by drop)

  • Each drop of NaOH adds Na⁺ and OH⁻.
  • The OH⁻ immediately neutralises H⁺:
  • H⁺ + OH⁻ → H₂O
  • Highly mobile H⁺ ions are being removed and replaced by less mobile Na⁺ ions.
  • Since Na⁺ has much lower mobility than H⁺, conductance drops steadily with each drop added.
  • Solution composition: Unreacted HCl + NaCl (salt)
  • Conductance falls sharply — the curve slopes downward from P to Q.

    C. At the Equivalence Point — Point Q

  • All H⁺ ions have been neutralised.
  • The solution now contains only NaCl + H₂O — no excess acid or base.
  • Na⁺ and Cl⁻ are present, but both have moderate, equal mobilities.
  • This is the minimum conductance point of the entire curve.
  • Point Q = Equivalence Point = End Point of the Titration.
  • D. After the Equivalence Point — Line QR (Excess NaOH)

  • Further addition of NaOH beyond the endpoint means excess NaOH is now dissolving into the solution.
  • NaOH adds Na⁺ and OH⁻ ions.
  • OH⁻ ions have the second highest ionic mobility after H⁺.
  • Conductance rises sharply again.
  • Solution composition: NaCl + excess NaOH
  • Conductance rises steeply — the curve slopes upward from Q to R.

    Summary Table

    StageWhat is happeningEffect on Conductance
    Initial (P)Only HCl — high [H⁺]Very High
    PQ (Before EP)H⁺ replaced by slow Na⁺Steadily Decreasing
    Q (Equivalence Point)Only NaCl in solutionMinimum
    QR (After EP)Excess OH⁻ addedSharply Increasing

    Why This Method Is Better Than Indicators

  • Works even with coloured or turbid solutions where visual indicators fail.
  • The V-shaped curve gives a very sharp, unambiguous endpoint.
  • Can be done with any combination of strong/weak acids and bases.
  • Does not require the solution to be transparent.
  • Key Inferences

    The sharp V-shape minimum at point Q is diagnostic of a Strong Acid vs. Strong Base conductometric titration.

    The steep fall (PQ) is due to loss of H⁺ (highest mobility ion) and its replacement by Na⁺ (lower mobility).

    The steep rise (QR) is due to addition of excess OH⁻ (second highest mobility ion).

    No colour change needed — the endpoint is read directly from the graph's minimum.

    Read next →Arrhenius EquationTypes of Reactions
    • Endpoint found by the V-shaped minimum in the conductance vs. volume graph
    • H⁺ has highest ionic mobility — initial conductance is very high
    • PQ falls: H⁺ replaced by slow-moving Na⁺ as neutralisation proceeds
    • Q (Equivalence Point): only NaCl + H₂O — minimum conductance
    • QR rises: excess OH⁻ added — second highest ionic mobility
    Contents
    Reaction InvolvedTitration CurveFour Stages of the TitrationA. Initial Stage — Point P (Before any NaOH is added)B. Before the Equivalence Point — Line PQ (Adding NaOH drop by drop)C. At the Equivalence Point — Point QD. After the Equivalence Point — Line QR (Excess NaOH)Summary TableWhy This Method Is Better Than IndicatorsKey Inferences

    Available Files1

    These original educational materials were created by Juber Aktar for JAtone. They are hosted on Google Drive or Google Slides for convenient access. Any future advertising will remain outside this file list and separate from the Preview and Download controls.

    Conductometric Titration — Strong Acid vs. Strong Base (HCl vs. NaOH)

    Presentation
    Physical Chemistry
    PreviewDownload

    About Conductometric Titration: Strong Acid vs. Strong Base — Curve & Notes PDF

    Conductometric Titration: Strong Acid vs. Strong Base — Curve & Notes PDF is a fundamental concept in physical chemistry. Understanding the mechanisms, reaction conditions, and stereo-chemical outcomes is crucial for mastering organic chemistry. Our curated resources provide step-by-step visualizations to help you excel.

    JAtone.
    JAtone.

    Premium, beautifully crafted visual guides and presentations for your academic journey. Let's grow together.

    STUDIO

    • About JAtone
    • Contact Us
    • Functional Group Explorer

    LEGAL

    • Privacy Policy
    • Terms of Service

    © 2026 JAtone. Cultivated for Students.

    PrivacyTerms

    SELF TEST

    Practice MCQs

    Question 1 / 5Score: 0

    Why is the initial conductance of a strong acid vs strong base titration so high?

    LEARNING SUPPORT

    Conductometric
    Titration: Strong Acid vs. Strong Base — Curve & Notes PDF FAQ

    Initially, the solution contains highly mobile H+ ions from the strong acid. As strong base is added, these fast H+ ions are neutralized and replaced by much slower-moving Na+ ions, causing overall conductance to fall.

    The V-shaped minimum represents the equivalence point. At this exact moment, all acid and base have neutralized, leaving only the salt (e.g., NaCl) and water, resulting in the lowest ion mobility in the process.

    After neutralization is complete, any additional strong base adds excess OH- ions to the solution. Hydroxide ions have the second-highest ionic mobility (after H+), causing the conductance to shoot up rapidly.